Using DipAnalyst 2.0
DipAnalyst 2.0 is an application
software for kinematic analysis of rock slope failure potentials and
calculating factor of safety values against failure. It is developed for stereonet-based analysis as well as a new
quantitative kinematic analysis. The quantitative kinematic analysis,
instead of relying on representative values, considers all
discontinuities and their possible intersections to calculate failure
indices. Failure indices are calculated based on the ratio of the number
of discontinuities that cause plane failures or toppling failures or the
number of intersection lines that cause wedge failures to the total
number of discontinuities or intersection lines. The software compares
every dip direction/dip value with slope angle and friction angle to
evaluate its potential to cause plane or toppling failure. It also calculates
all potential intersection line plunge direction and amount for
wedge failure potential.
A higher index value for a given type of failure
indicates a greater chance for that type of failure to occur.
DipAnalyst 2.0 also allows a simple sensitivity analysis to
evaluate the change of failure indices with changing friction angles, slope angles,
and slope azimuths. The
quantitative approach for kinematic analysis can be easily interpreted
by professionals who are not familiar with the use of stereonets.
Using
DipAnalyst

New data can be entered directly onto the dip
direction and dip columns or can be imported from a .csv file, where the
first column contains dip direction and the next column contains dip
values. csv files can be created with Microsoft excel. Dip direction and
dip data can be saved as .csv file.
![]() Refresh
Refresh
The ‘Discontinuity Intersection Calculator’ tool
calculates the azimuths and plunges of all possible lines of
intersection between all possibly intersecting discontinuity planes.
Once executed, the other icons will be functional.
![]()
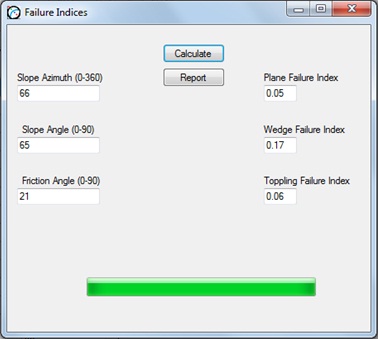
Failure indices are calculated based on the ratio
of the number of discontinuities that cause plane failures/toppling
failures or the number of intersection lines that cause wedge failures
to the total number of discontinuities or intersection lines. The
analysis would require valid slope azimuth, slope angle, and friction
angle data. A higher index value for a given type of failure indicates a
greater chance for that type of failure to occur. The ‘Calculate Failure
Indices’ tool calculates all three failure indices as shown below. The
resulting failure index can be exported as a text file by
clicking the ‘Report’ button.
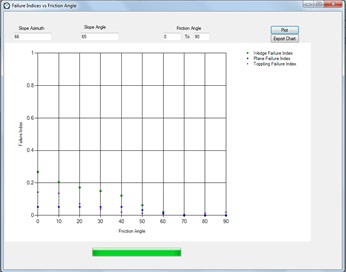
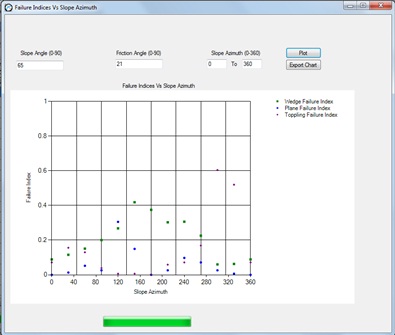
Sensitivity Analysis
The change in failure indices as a result of
changing friction angle, slope angle, and slope azimuth is calculated.
The user can modify the range of friction angles, slope angles and slope
azimuths for which the sensitivity analysis can be performed. A scatter
plot for each sensitivity analysis can be drawn. The scatter plots can
be exported as a .bmp file by clicking the ‘Export Chart’ button.
Examples of sensitivity analyses are shown below.
![]() Failure
Index vs Friction Angle
Failure
Index vs Friction Angle
![]()
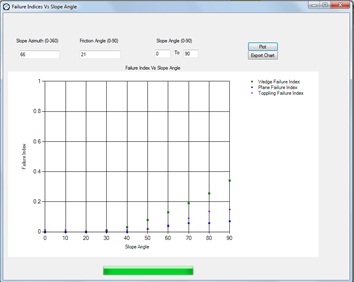
![]() Failure
Index vs Slope Azimuth
Failure
Index vs Slope Azimuth
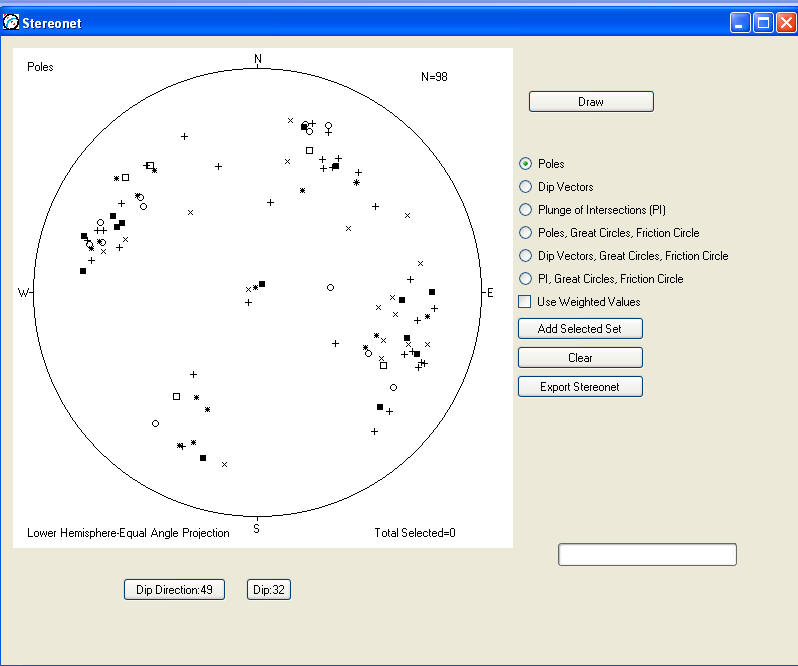
![]() Stereonet
Stereonet
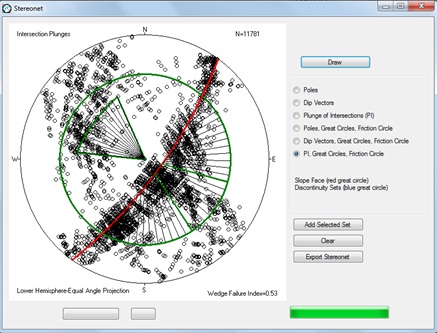
The ‘Stereonet’ tool opens the ‘Stereonet’ window.
Poles, dip vectors and plunge of all possible intersection lines can be
plotted on the stereonet by clicking ‘Draw’ button. Based the symbol
codes entered in the data entry, dip vectors and poles may be
represented by different symbols.
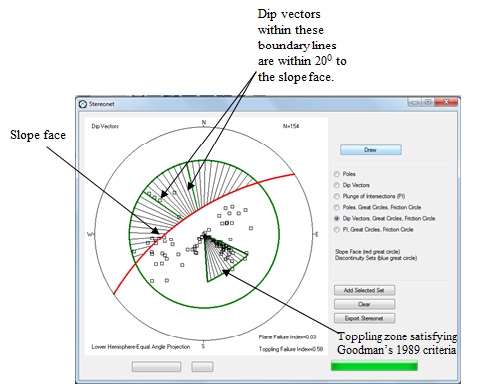
The stereonet-based kinematic analysis for wedge failure can be performed based on plunges of all possibly intersecting discontinuity planes as shown below.
Selection of Discontinuity Sets
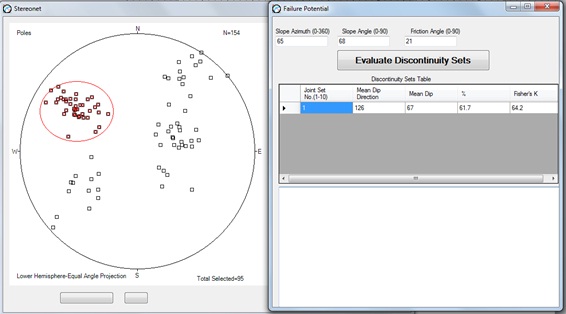
Cluster of discontinuities can be visually
identified from pole plot of discontinuities. Selection can be done by
left clicking at the upper left corner of the cluster set and holding
down the mouse until reaching the lower right corner of the cluster set.
The selected poles will be highlighted and the boundary around the
selected set will be visible. The mean dip direction, dip, percentage of
selected discontinuities, and Fisher’s K value can then be added into
discontinuity set table by clicking the ‘Add Selected Set’ button.
Clicking ‘Add Selected Set’ would also open the ‘Failure Potential’
window which contains the discontinuity set table.
Evaluating Discontinuity Sets
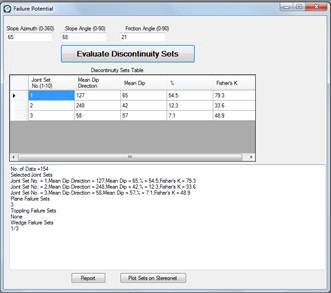
The selected joint sets can be evaluated by
clicking the ‘Evaluate Discontinuity Sets’ button. The result is a text
report of the mean dip direction, mean dip, percentage of selected
discontinuities, and Fisher’s K values. It will indicate on which
discontinuity sets would cause plane and toppling failures as well as
which intersecting discontinuity cluster sets will cause wedge failures.
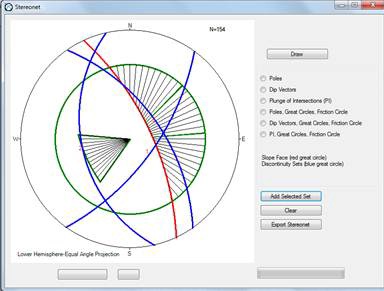
Great circles representing discontinuity sets,
slope face and the friction circle will be drawn by clicking ‘Plot Sets
on Stereonet’ button.
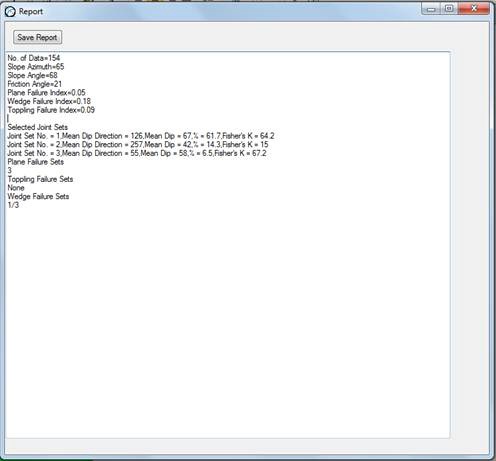
![]() Report
Report
The ‘Report’ tool will open a window with a text box
showing the result of failure indices calculation performed within the
‘Failure Indices’ window and discontinuity set evaluation within the
‘Failure Potential’ window. The ‘Report’ button should be clicked in the
‘Failure Indices’ window and/or ‘Failure Potential’ window for the
‘Report’ tool to record a report.
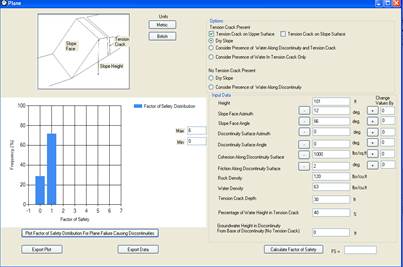
 Plane
Plane
The ‘Plane Failure’ tool opens the window for plane
failure analysis. There are two options of analyses
that
DipAnalyst 2.0 provides. The ‘Calculate Factor of Safety’ button
performs the calculation of factor of safety for one discontinuity plane
based on the input data. The ‘Plot Factor of Safety Distribution For
Plane Failure Causing Discontinuities’ plots a histogram of distribution
of F.S values for all potentially plane failure-causing discontinuity
planes entered in the discontinuity entry page. It first identifies
discontinuities that have the potential for plane failure, calculates
their factor of safety values, and plots a histogram. The factor of
safety values can be exported.
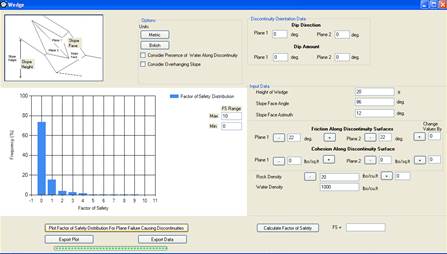
 Wedge
Wedge
The ‘Wedge Failure’ tool opens the wedge failure analysis window.
Similar to plane failure analysis,
DipAnalyst 2.0 can
calculate factor of safety for a single wedge defined by a pair of
discontinuities as well as plot distribution of factor of safety values
for all possible intersecting discontinuities that potentially can lead
to wedge failures. The factor of safety values can be exported.